User interface: Difference between revisions
| Line 131: | Line 131: | ||
To use feed forward only (i.e. set output directly from ref), enable controller, but set Kp=0, and enable feed forward with some value for Kf (when Kf = 1 then ref is used directly af output). | To use feed forward only (i.e. set output directly from ref), enable controller, but set Kp=0, and enable feed forward with some value for Kf (when Kf = 1 then ref is used directly af output). | ||
NB! As velocity measurements are rather noisy, the filter in the feedback path could be implemented as a low-pass filter with tau_1 = 0 and tau_1 = 0.005. | |||
=== IMU=== | === IMU=== | ||
Revision as of 16:27, 12 January 2021
Back to Regot main page
Screen dumps
The user interface can configure and run the robot, as well as inspecting almost all values on the robot. Written in python using Qt GUI library.
The interface looks like on figures below.
In general:
- Yellow fields are read-only (updates from the robot when connected).
- White fields are editable
- Editable fields require (in general) that an "edit" button is pressed first and a "save" button after the edit.
- Many check-fields gets implemented as they ate checked/unchecked, but not all.
- Data is updated from the robot at a rather low update rate, if data is to be used for documentation, then use the on-board log function.
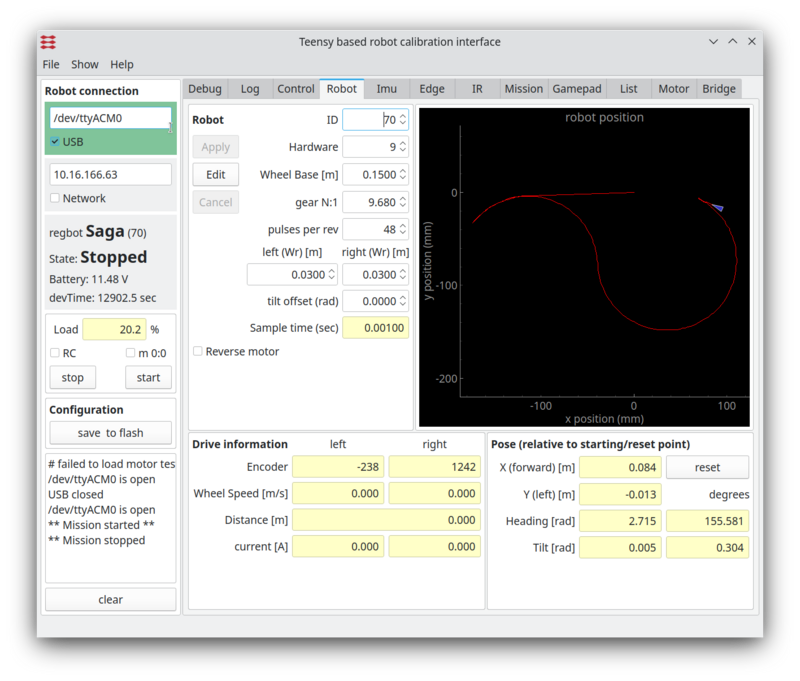
Figure 1. The general settings for the robot. The left panel is the general connection status and space for some messages from the robot. The central tab is mostly for configuration of the robot and some sensor and calculated values like pose and tilt. To the right is a fast graph of the last mission. NB! the data rate is low, so this is just to get an overview, use the log-function for more details.
Data logger
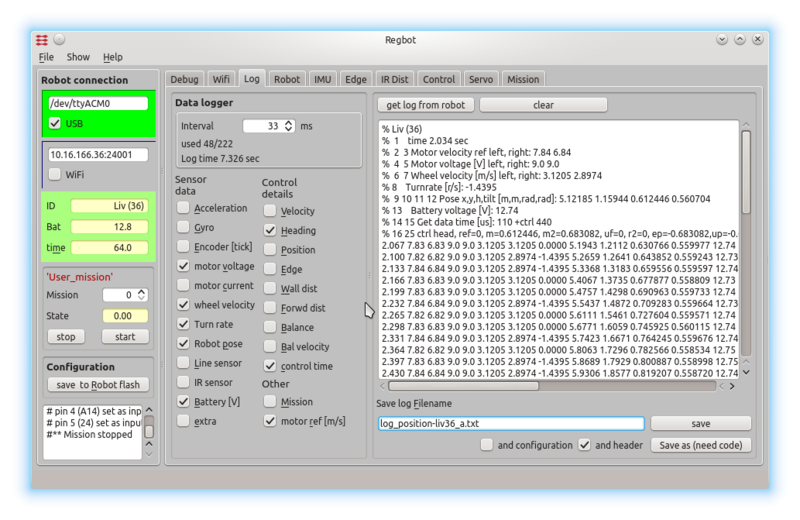
Figure 2. The data logging options. A number of sensor values and interface points in the robot software can be logged. The text window shows loaded data from a mission. The log format is designed to be directly compatible with the 'load' function in MATLAB.
Use a script like this in MATLAB
clear
close all
% Liv (36)
%  1    time 2.005 sec
%  2  3  4  5   (mission 0), state 2, entered (thread 1, line 1), events 0x0 (bit-flags)
%  6  7 Motor voltage [V] left, right: 0.49 -2.11
%  8  9 Encoder left, right: 4294967021 25
% 10 11 Wheel velocity [m/s] left, right: -0.0885 0.0759
% 12 15 Chirp amplitude=0, frequency =0 rad/s, phase=0 rad, value=0
%%
data = load('log_position-liv36_b.txt');
%% plot motor voltage and velocity
figure(100)
hold off
plot(data(:,1), data(:,6), 'linewidth', 2)
hold on
plot(data(:,1), data(:,10), ':', 'linewidth', 2)
grid on
legend('left voltage [V]', 'left vel [m s^{-1}]', 'location','northwest');
xlabel('Time [sec]')
The top text lines of the logfile is copied to the MATLAB script to ease identification of data to plot.
ACC and gyro
Acceleration logs the acceleration values in m/s^2 on all 3 axis (x (forward if in balance),y (left), z (up if in balance))
Gyro is rotation velocity around the same 3 axis. Unit is degrees per second (after calibration offset).
Encoder
Encoder values for wheel rotation (left, right) 48 values per rotation, increases on forward.
Motor voltage
Is the motor voltage - before conversion to PWM, is compensated for changes in battery voltage.
Motor current
Filtered current sensor values. zero current is calibrated just before start of a mission - this calibration sometimes make a mistake, resulting in a bad offset of the logged current. Value is in Amps. The value is filtered to match the log-interval, if interval is > 2ms.
Wheel velocity
Based on time between encoder tics. If more tics within 1ms, then the interval time is averaged. When there is long time between tics (>50ms), then time since last tick is used to calculate velocity, i.e. velocity goes towards zero with time if no encoder pulses arrive.
Turn rate
Is turn rate based on encoder tics (not the gyro), unit is radian/sec
Robot pose
Is position since start of mission (odometry coordinates), x,y,h,t where h is heading in radians (positive counter clockwise), and t is tilt in radians (zero is in balance, positive is forward).
Line sensor
All values related to line sensor, including AD value from each sensor.
IR sensor
Is distance converted to meters for each sensor (default is sensor 1 is right and sensor 2 is forward.
Battery
Battery voltage in Volts.
Extra
Debug feature for log of extra values.
Mission
State, Thread, Line, Event. Where State is mission state (should always be 2, or 8 when stopping), thread number and line number in that thread, for the latest line activated (if more than one is activated in the same log interval, then the latest is logged. Event is a 32bit integer where each bit corresponds to an event number, events are accumulated over the logging period.
Motor ref
Is the desired motor velocity (input to velocity controller) - in m/s
Control time
Is the time taken to handle sensor data, calculate control values and advance in mission lines - this should be finised within 1ms. Value is in micro seconds, so should be below 1000 to ensure valid control calculations.
Control details
Value order: r, m, m2, uf, r2, ep, up, ui, u1, u
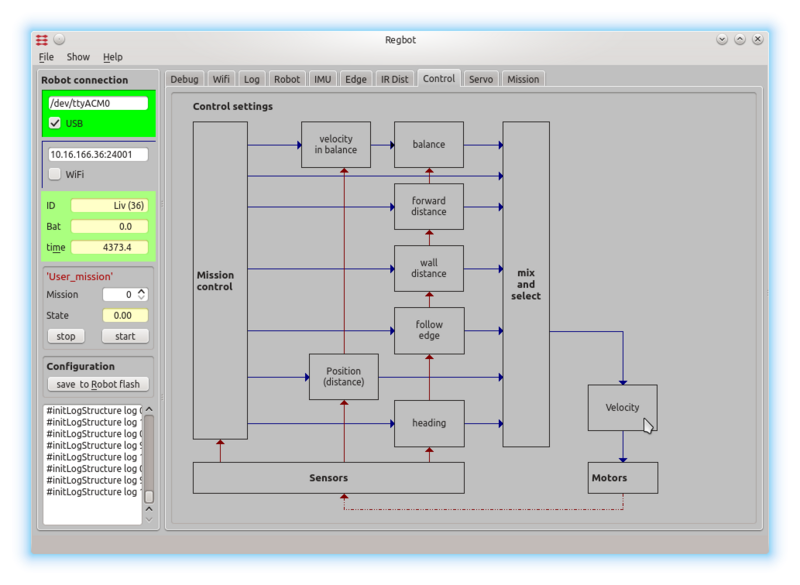
The control details gives details at data points connected to or inside the general PID controler design used for all control settings. These control data points are illustrated in the figure below.
Controller configuration
All controllers can be configured from the "control" tab. See the Control page for more control details.
Figure 4b. All control values are set from this page, click on the relevant controller and enter the relevant values in the dialogue window shown below.
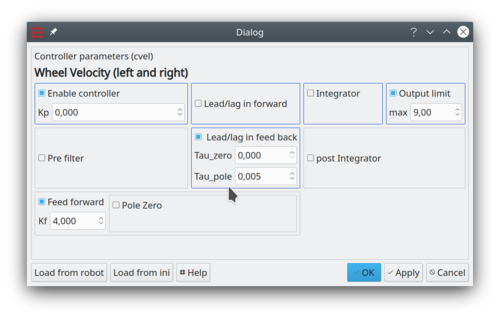
Figure 5. This dialogue configures the wheel velocity controller - shown as a PI-Lead-controller with feed-forward and an output limit at (+/-) 9V. All other options are disabled. The blue frame boxes indicate a traditional PID controller with lead in forward (and)/or in the feed back branch.
When "enable controller" is disabled, then the control is disabled.
To use feed forward only (i.e. set output directly from ref), enable controller, but set Kp=0, and enable feed forward with some value for Kf (when Kf = 1 then ref is used directly af output).
NB! As velocity measurements are rather noisy, the filter in the feedback path could be implemented as a low-pass filter with tau_1 = 0 and tau_1 = 0.005.
IMU
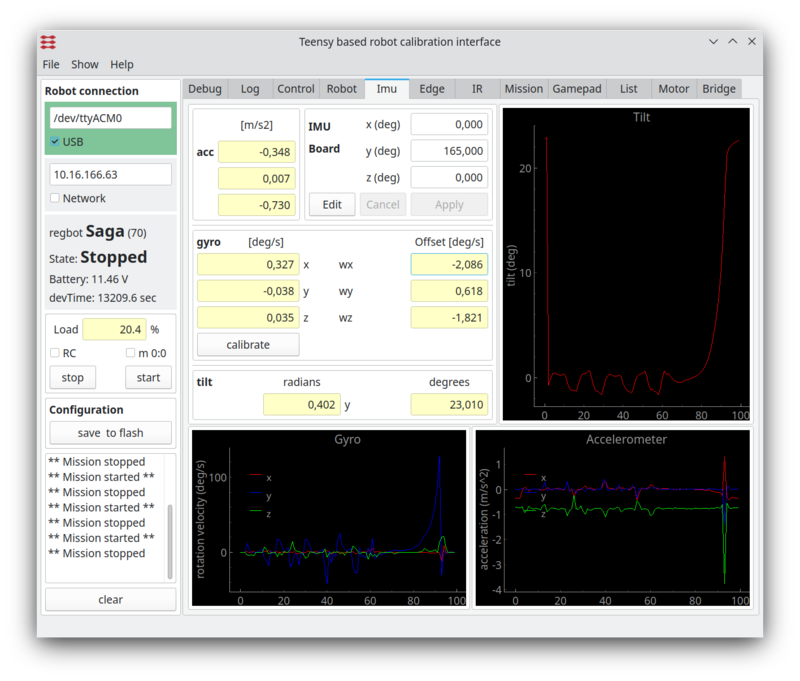
The IMU page shows data from the IMU, and is used for tilt measurement for the balance controller only.
Figure 5.1 IMU data. The graph shows calibrated values, and the gyro is calibrated by keeping the robot satble and press the "calibrate" button. (remember to save the result in robot flash). The servos drift slightly, so repeat if needed.
Menu
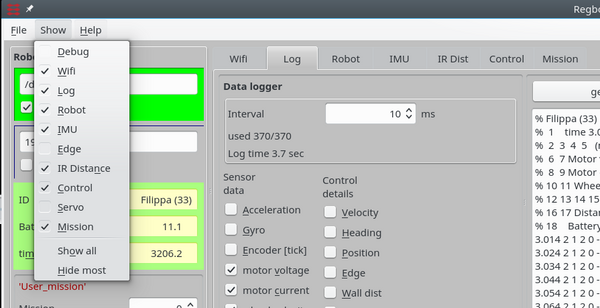
Figure 6. Other tab pages are available from the "show" menu.
Mission
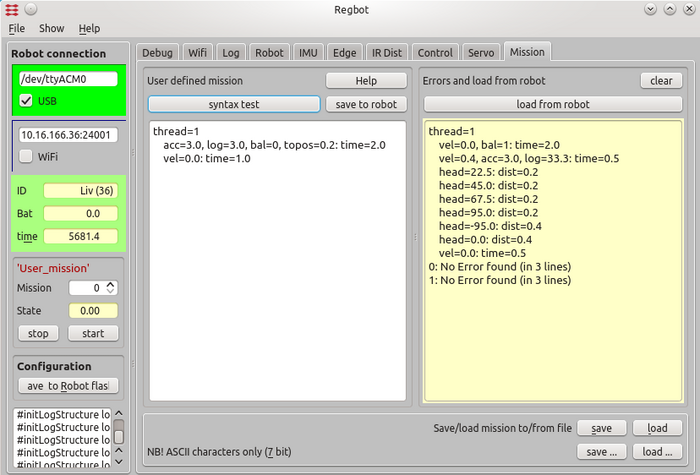
Missions are entered through the mission tab:
Figure 7. Missions are entered in the left (white) area, and can be syntax tested with the button above. The result of the check is shown in the yellow area (right). The mission on the robot can be fetched to the right area. Missions (the left area) can me saved and loaded from text files with the buttons below.
If you copy-paste from another application, so make sure not to include any formatting, 7-bit ASCII characters are allowed only.
Missions are not saved to the robot before you press "save to robot".
The mission is lost for the robot after a power cycle, unless you save the configuration to robot flash - using the "save to robot flash" to in the left pane.
Mission lines
Mission specification consist of mission lines, each line consist of two (lower case) parts divided by ':'
drive parameter: continue condition
continue conditions are OR'ed.
e.g.:
vel=-0.2, acc=3.0 : dist=1, time=12
Drive backwards at a speed of 0.2m/s, accelerate with 3m/s2 to this speed, until a distance of 1 meter is driven or 12 seconds has passed.
See Mission for more details.
