Flexbot visualizer
Back to Flexbot main page
Introduction
The Flexbot Visualizer have been created as a tool for everyone using and working on Flexbot. The GUI will allow users to connect wirelessly to Flexbot with the ultimate purpose of receiving and sending messages in real time. The GUI also features very basic element that allows the user excite all actuators (as a controller) in real time. This is meant for testing purposes only and not as a gamepad for driving Flexbot around. (although that sounds quite fun!)
Dependencies
The GUI is developed with Qt in C++ and should be run from the source/project files, i.e. there exists no executable format of this application. Qt supports all operating systems and is not depended on anything but its own libraries.
This means that Qt must be downloaded and installed. Qt can be downloaded from https://www1.qt.io/download/ - choose Desktop Applications and then the Open Source version. Note that Qt is a heavy gentlemen and will require approximately 5 GB of free space. The upside is that Qt comes with a very nice IDE that can be used for all projects (not only Qt applications).
Other than Qt, make sure to pull the newest version of the Flexbot git repository.
Instructions on how to use
This section will split down the "user manual" in small steps ensuring that all users should be able to navigate and utilize the GUI after reading this.
Running the Application
Start by firing up Qt Creator - on the welcome screen choose to open a project. From here locate and select
flexbot_visualizer.pro
which should be found under /code/GUI/flexbot_visualizer. This should open up the project including all project files.
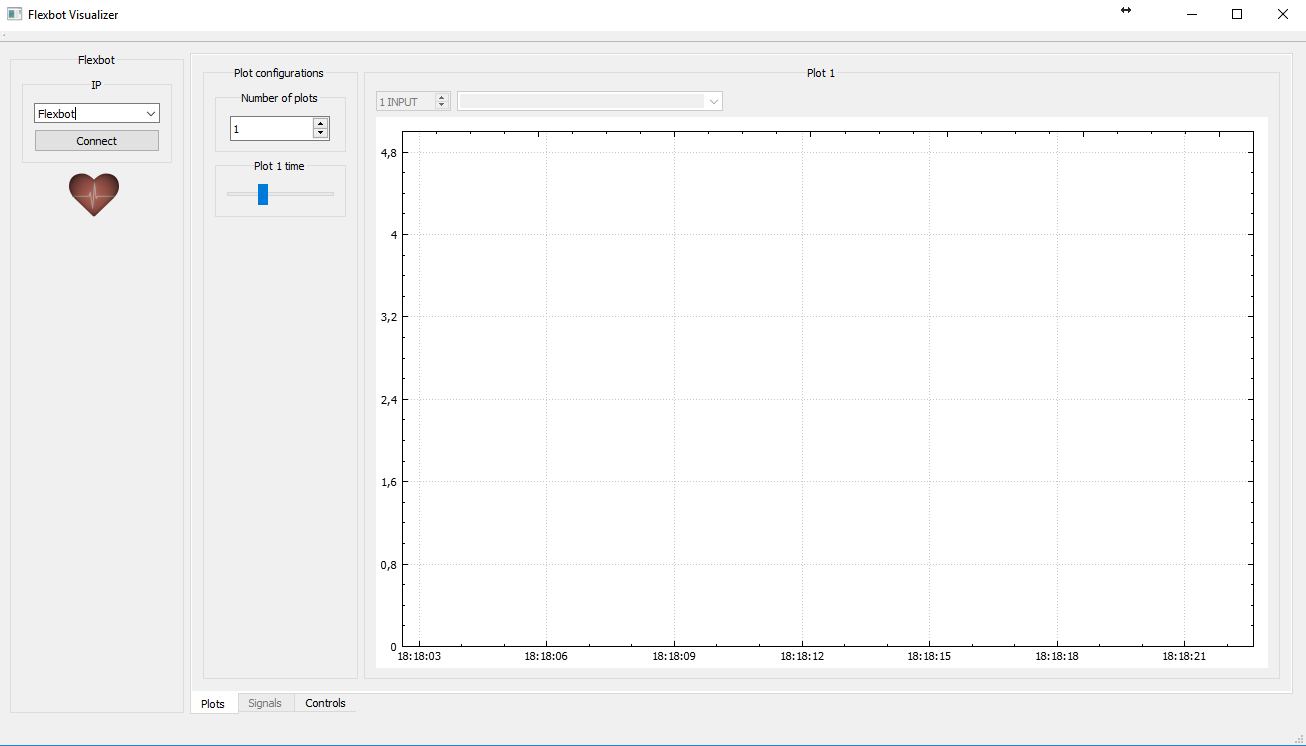
Run the application by pushing the green "play"-button or by pressing Ctrl+r. This build and run should the application ultimately opening window as shown below

Connecting to Flexbot
All communication to the Flexbot goes through the Intel NUC mounted on the Flexbot. The NUC will be running a very simple Python script that serves as a bridge for communication. Basically all it does is broadcast everything it receives over the USB serial interface to the network, and write everything it receives over the network to the Teensy via the USB serial interface.
Connect to Flexbot WiFi hotspot
ssid: NUC
pw: grenen89
If the Python script somehow isn't running automatically (it should), SSH into the NUC, go to ~/flexbot/code/MAVLink/Bridge and start the script by typing
python FlexbotBridge.py
When the bridge is running, and the client laptop/PC is connected to the NUC-network, press the connect button on the GUI. This will bind to the multicast IP and port that Flexbot broadcasts to as well as it will the flexbot.xml message definitions file and initialize all available signals. Not that the flexbot.xml file should be located in the same folder as the flexbot_visualizer but if it isn't found, the GUI will automatically warn the user about this and open a file browser that will let the user locate the file themself.
To verify that connection is established, the heartbeat should pulse once a second or so.
Subscribing to Signals
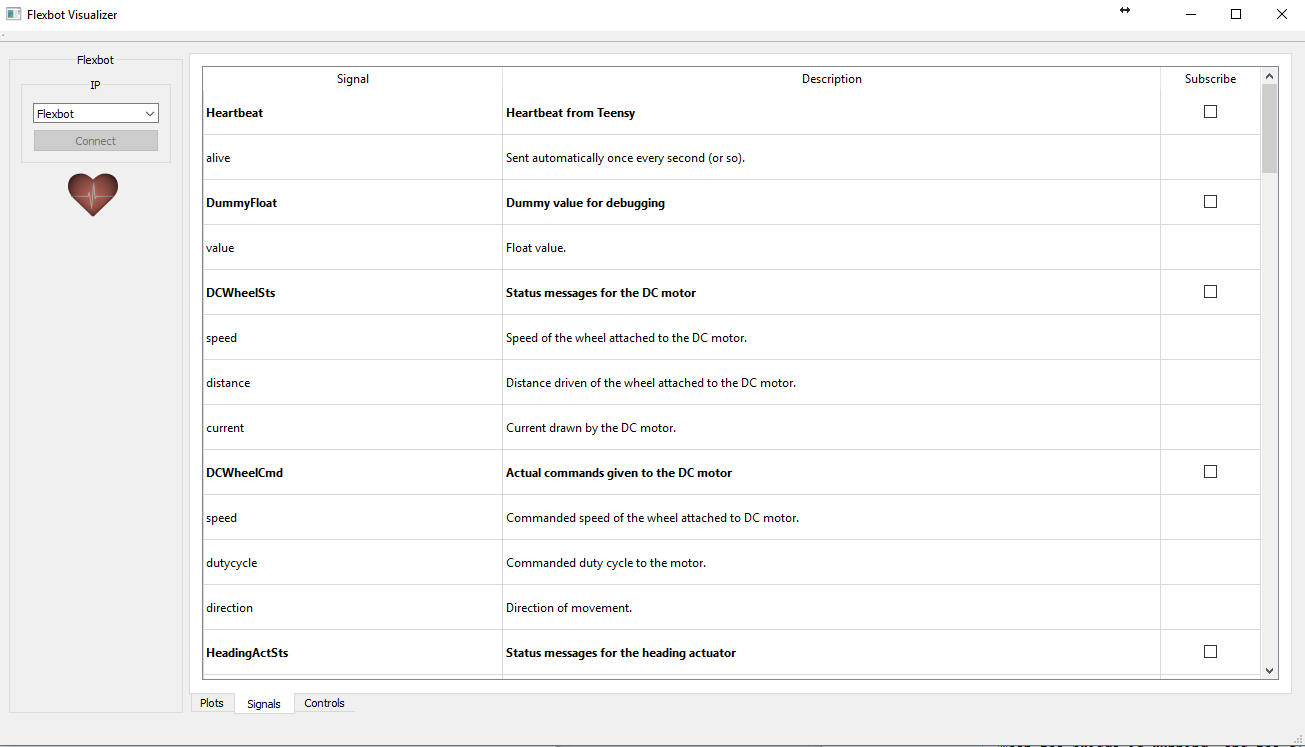
After connecting to Flexbot, the Signals tab will be available. From here all signals to/from Flexbot are listed as shown below

In order to subscribe to a signal, i.e. receiving for real-time data visualizing, simply press the subcribe checkbox available for each message. When not listening in on specific messages, users should unsubscribe to them (and save bandwidth) by clicking the checkbox again.
Real-Time Data Visualization
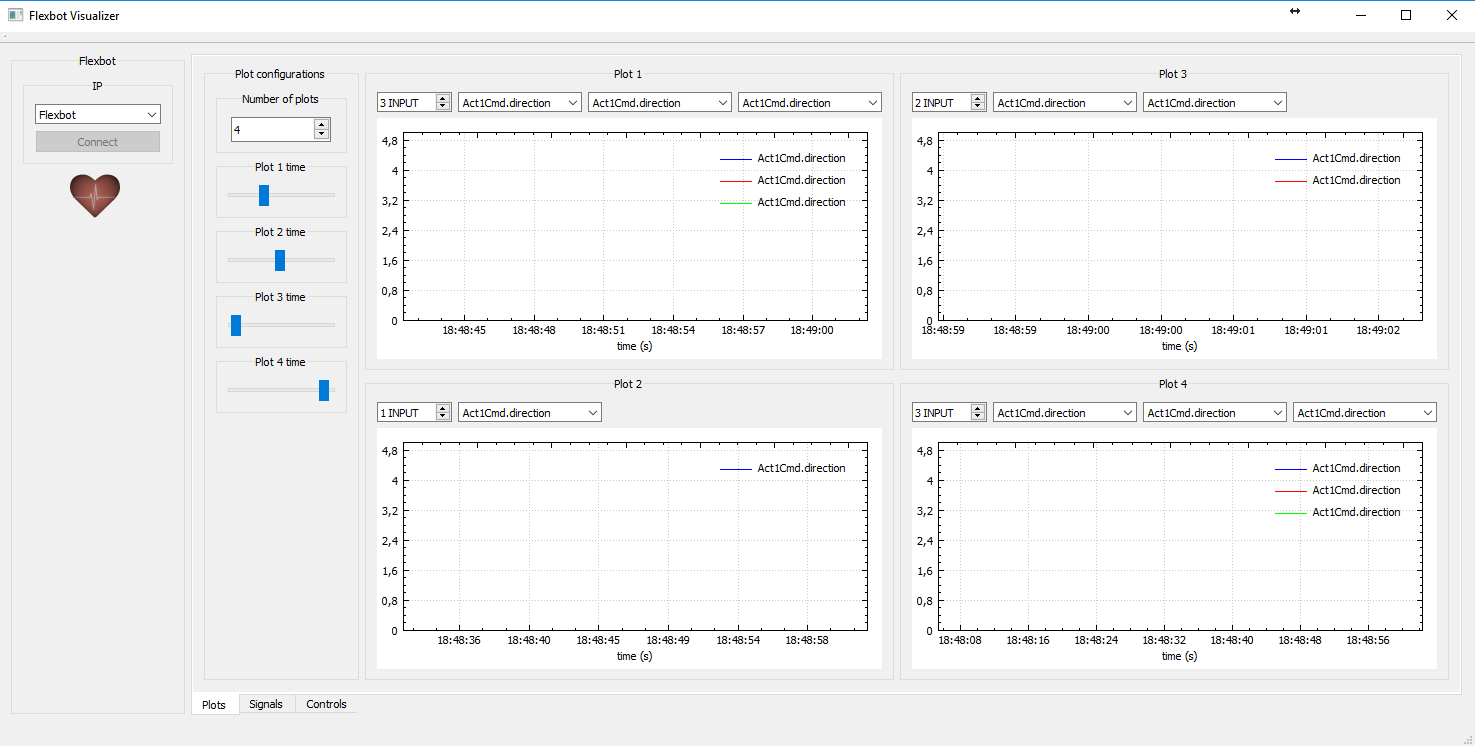
After a message have been subscribed to go back to the Plot tab. Here it is possible to generate up to four plots at once, each capable of plotting three messages at a time. An example of this is shown below

The time-slider sets the time-window visualised for each graph.
Basic Control Interface
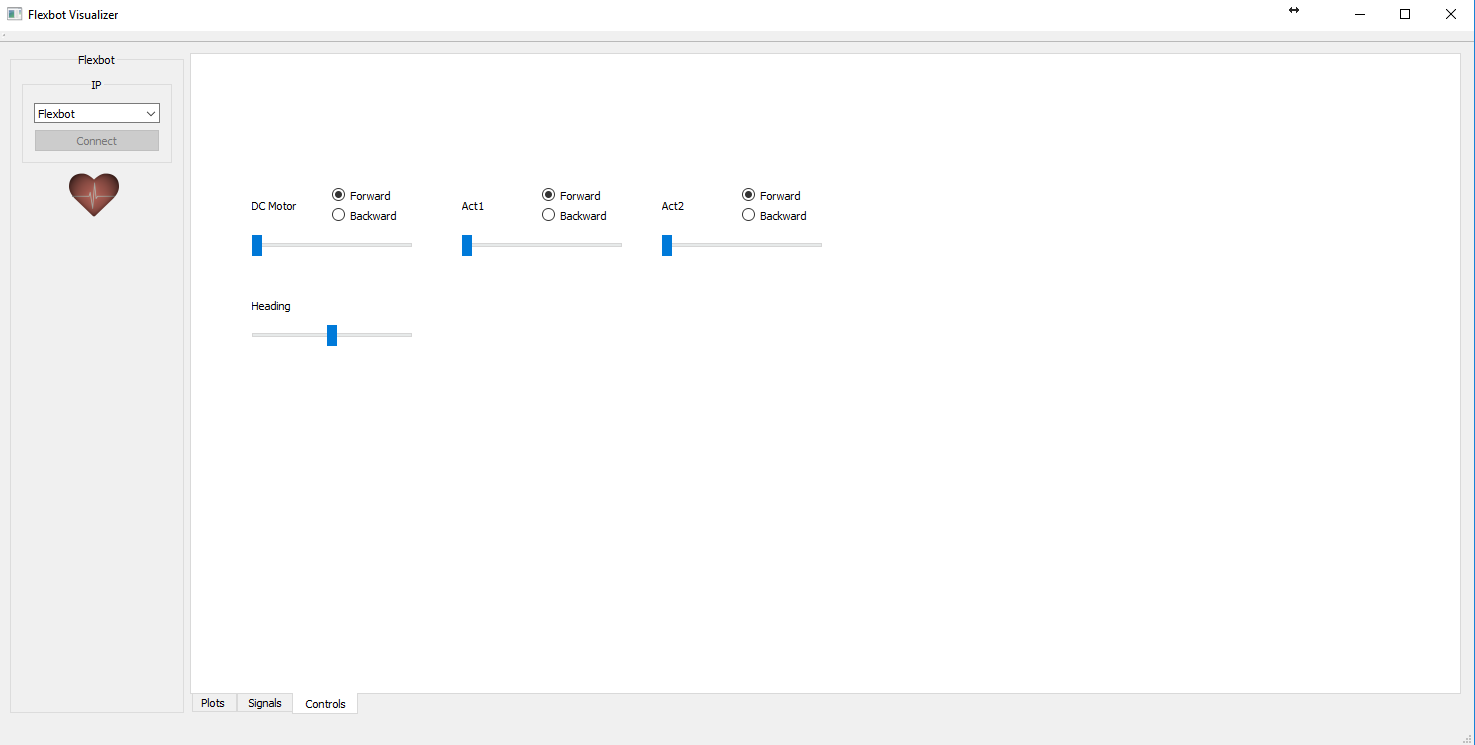
The third tab Controls serves as very simple control interface to Flexbot. At the time writing is looks something like shown below

From here each actuator of the currently build robot leg can be controlled and tested.
This could and should (at some point) be extended to include the possibility to set reference inputs to Flexbot to obtain step-response and permit online tuning of controllers. However, at this point it only serves as very basic interface to test and run each actuator.
Closing Remarks
In the time of writing the application is still very new. Their may arise some issues along the way and the code might contain a few bugs.
For questions regarding the GUI or bug fix requests (that you are not able to fix yourself), please refer to Jesper H. Christensen: jesper@haahrchristensen.dk