Robobot linesensor description
Back to Robobot
Line edge sensor
The data from a 4-second test drive is analyzed. A video can be seen at this link.
https://panopto.dtu.dk/Panopto/Pages/Viewer.aspx?id=a7a5d643-a2df-4ed2-b019-b0e600c96a4e
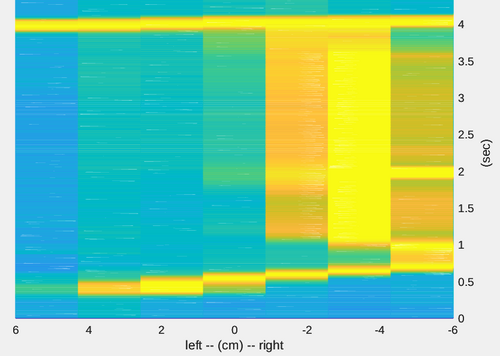
Sensor heat map
Figure. Line sensor values (normalized). After 0.3 sec a line is detected. The robot is asked to follow the left edge. The robot is therefore turning left to have the left edge centered below the robot. After 2 seconds there is a crossing line to the right. After 4 seconds a crossing line is seen, both left and right, and then nothing.
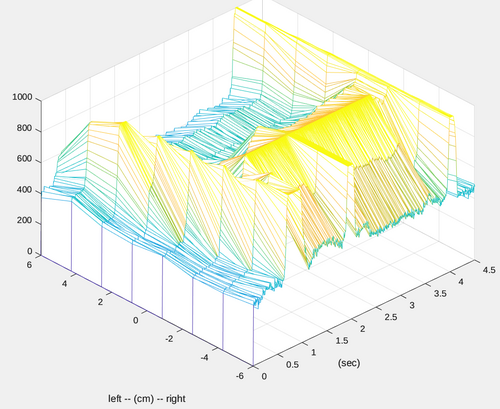
3D view of sensor values
Figure. The same data as above is now shown with amplitude. The data is normalized so that calibrated white is 1000 and calibrated black is 0. The wooden floor has a level of about 400. The edge is detected with a threshold of 700, if any sensor is above 700, then a line is deemed to be valid.
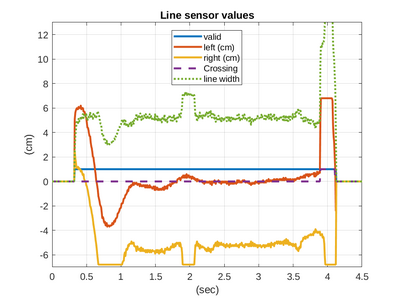
Sensor values
Figure. The line becomes valid after about 0.3 seconds, here the left edge (red) is seen 6cm to the left (of the robot center line). The robot then turns left, a bit too much, and then keeps the left edge centered with the robot. The line width (green dotted) is estimated to be about 5cm, it is 4.3cm, so a bit over-estimated. After 2 seconds, the line width expands to about 7 cm, but this does not trigger the crossing line flag, as the threshold is set to 8cm. After 4 seconds a crossing line is detected.


