Robobot linesensor description
Back to Robobot
Back to Software description
Line edge sensor
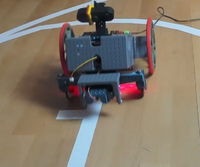
Figure. An important part of the Robobot is the ability to follow a line. This page focuses on this part.
Line sensor (sedge)
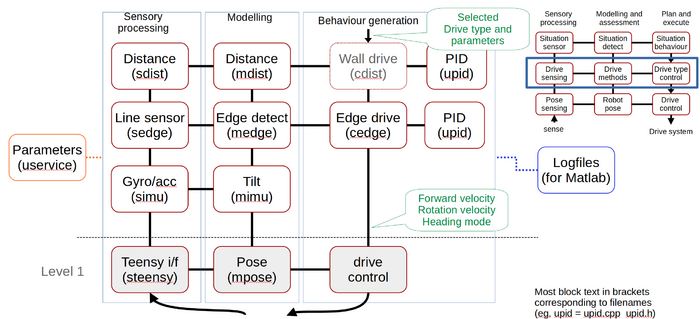
The 'Line sensor (sedge)' receives the raw line sensor data from the Teensy.
The data is generated from two measurements for each sensor, one measurement when the LED illumination is on, and one measurement, when the illumination is off. The difference between these two is received by the sedge module.
Each sensor has a slight overlap with the neighboring cells dependent on the distance from the sensor to the floor.
The data rate is controlled by this module from the settings in the 'robot.ini' configuration file in the [edge] section:
[edge]
rate_ms = 8
lograw = true
highpower = true
printraw = false
...
The data rate is here 8 ms, the data is generated every 1 ms, but 8 ms should be sufficient and there is a limit to the data transfer speed on the USB connection (4000-5000 messages per second should be possible).
The raw data can be logged and looks like this
% Linesensor raw values logfile (reflectance values)
% Sensor power high=1
% 1 	Time (sec)
% 2..9 	Sensor 1..8 AD value difference (illuminated - not illuminated)
1703755938.9043 0 0 0 0 0 0 0 0
1703755938.9114 234 303 327 319 326 293 272 230
1703755938.9198 246 315 341 329 325 291 277 239
1703755938.9276 226 303 333 312 308 286 274 228
...
Edge detect (medge)
This module normalizes the sensor data based on a sensor calibration; then three data items are extracted from the data:
- Left edge (in meters relative to the robot centre axis)
- Right edge (m)
- Line width (m)
These three values are valid only if the 'edge valid' flag is true. Otherwise, the values will be zero.
Edge detect option
The function gets supplementary from the robot.ini configuration file from the [edge] section:
[edge]
...
sensorwidth = 0.12    (in meters)
calibwhite = 424 544 611 598 621 551 525 444 (average raw values when looking at a white line)
calibblack = 121 105 144 147 123 142 124 90  (average raw values when looking at something black)
whitethreshold = 700  (normalized value for detection of white)
log = true            (log detections (to log_edge.txt))
print = false         (print detections to the console)
lognorm = true        (log the normalized sensor values (to log_edge_normalized.txt))
...
Line sensor calibration
The calibration influences how the data is normalized.
See the data analysis below.
Calibrate on white
To calibrate the edge sensor:
- Place the robot so that the sensor illuminates a white line (the illumination will turn on during calibration, so repeat if you didn't hit the line first time).
- Start the raubase with a white parameter; Note the new values will overwrite the old value in the robot.ini configuration file!:
cd svn/robobot/raubase/build
./raubase --white
...
# Old calibration values:
# white:   409   515   576   567   581   523   506   433
# black:   121   105   144   147   123   142   124    90
# New calibration values:
# white 424 545 613 601 620 544 521 447
# --------- terminating -----------
# UService:: configuration saved to robot.ini
Calibrate on black
- Place the robot on a homogeneous black surface, i.e., a black piece of paper or looking at something far away. Another alternative is looking at the darkest floor you can find.
- start the raubase with a --black parameter.
An example of black calibration (on a black fabric bag) could be:
./raubase --black
...
# Old calibration values:
# white:   424   545   613   601   620   544   521   447
# black:   121   105   144   147   123   142   124    90
New calibration values:
# black 15 18 23 18 19 17 18 14
# --------- terminating -----------
# UService:: configuration saved to robot.ini
Edge data analysis
The data from a 4-second test drive is analyzed. A video can be seen at this link.
https://panopto.dtu.dk/Panopto/Pages/Viewer.aspx?id=a7a5d643-a2df-4ed2-b019-b0e600c96a4e
Normalized data
% Edge sensor logfile normalized 'log_20231228_103218.821/log_edge_normalized.txt'
% 1 	Time (sec)
% 2..9 	Sensor value in 0..1000 scale for black to white
% 10 	Line width (m)
1703755938.9114 372 451 391 381 407 369 369 395  0.0000
1703755938.9198 412 478 421 403 405 364 381 420  0.0000
1703755938.9276 346 451 404 365 371 352 374 389  0.0000
1703755938.9360 405 478 415 401 405 383 391 409  0.0000
1703755938.9434 402 451 413 383 391 378 376 395  0.0000
...
1703755939.2074 488 615 584 447 423 381 408 451  0.0000
1703755939.2154 468 662 655 487 423 378 403 460  0.0000
1703755939.2243 491 685 670 496 405 352 394 451  0.0000
1703755939.2321 521 735 743 529 433 378 421 460  0.0263
1703755939.2403 551 792 828 574 423 396 428 488  0.0364
1703755939.2482 561 831 871 614 431 364 418 454  0.0415
1703755939.2553 561 863 929 662 431 391 431 466  0.0462
1703755939.2633 584 897 982 678 445 398 433 485  0.0493
1703755939.2723 567 876 989 680 423 371 411 471  0.0483
1703755939.2803 557 892 997 667 419 369 381 440  0.0477
1703755939.2876 590 908 1000 700 433 391 411 460  0.0512
1703755939.2955 580 902 997 671 421 386 401 449  0.0490
1703755939.3035 580 883 1000 696 425 378 403 435  0.0500
1703755939.3117 577 895 1000 694 423 391 416 443  0.0500
...
extracted edge data
The extracted edge data log looks like this
% Edge sensor logfile log_20231228_103218.821/log_edge.txt
% 	Calib white 424 544 611 598 621 551 525 444
% 	Calib black 121 105 144 147 123 142 124 90
% 	White threshold (of 1000) 700
% 1 	Time (sec)
% 2 	Edge valid
% 3 	Left edge position(m)
% 4 	Right edge position (m)
% 5 	Crossing valid (width > 8cm) - removed in newer versions
% 6 	Line width (m)
1703755938.9043 0 -0.000 -0.000 0 0.0000
1703755938.9114 0 -0.000 -0.000 0 0.0000
...
1703755939.2154 0 -0.000 -0.000 0 0.0000
1703755939.2243 0 -0.000 -0.000 0 0.0000
1703755939.2321 1 0.051 0.025 0 0.0263
1703755939.2403 1 0.056 0.019 0 0.0364
1703755939.2482 1 0.058 0.016 0 0.0415
...
1703755939.5034 1 0.020 -0.035 0 0.0552
1703755939.5116 1 0.016 -0.038 0 0.0539
1703755939.5195 1 0.013 -0.041 0 0.0541
1703755939.5276 1 0.009 -0.044 0 0.0528
1703755939.5355 1 0.006 -0.048 0 0.0533
1703755939.5433 1 0.001 -0.051 0 0.0524
1703755939.5513 1 -0.001 -0.055 0 0.0536
1703755939.5595 1 -0.004 -0.060 0 0.0560
1703755939.5675 1 -0.007 -0.064 0 0.0575
1703755939.5755 1 -0.012 -0.068 0 0.0550
1703755939.5835 1 -0.014 -0.068 0 0.0538
1703755939.5913 1 -0.016 -0.068 0 0.0519
1703755939.5995 1 -0.019 -0.068 0 0.0485
...
1703755940.6238 1 -0.004 -0.054 0 0.0503
1703755940.6318 1 -0.003 -0.053 0 0.0497
1703755940.6399 1 -0.002 -0.054 0 0.0519
1703755940.6480 1 -0.001 -0.054 0 0.0523
1703755940.6561 1 -0.002 -0.051 0 0.0495
1703755940.6640 1 -0.001 -0.053 0 0.0514
1703755940.6718 1 0.000 -0.054 0 0.0546
1703755940.6801 1 -0.001 -0.053 0 0.0517
1703755940.6879 1 -0.001 -0.051 0 0.0497
Sensor heat map
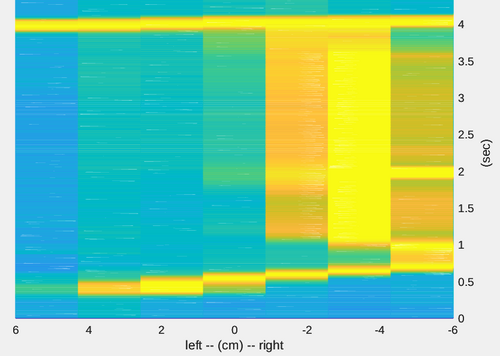
The sensor has 8 detectors that deliver the difference between illuminated and not illuminated as an analogue value.
Figure. Line sensor values (normalized). After 0.3 sec, a line is detected (orange-yellow values). The robot is asked to follow the left edge. The robot is therefore turning left to have the left edge centered below the robot. After 2 seconds there is a crossing line to the right. After 4 seconds, a crossing line is seen, both left and right, and then nothing.
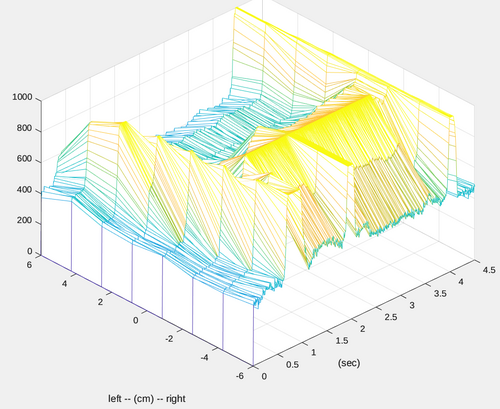
3D view of sensor values
Figure. The same data as above is now shown with amplitude. The data is normalized so that calibrated white is 1000 and calibrated black is 0. The wooden floor has a level of about 400. The edge is detected with a threshold of 700, if any sensor is above 700, then a line is deemed to be valid. The sample rate is 8ms.
Sensor values
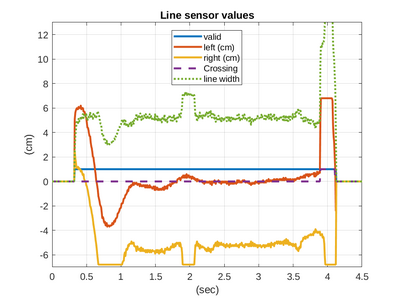
Figure. The line becomes valid after about 0.3 seconds; the left edge (red) is 6cm to the left (of the robot's centre line). The robot then turned left a bit too much and then kept the left edge centered with the robot. The line width (green dotted) is estimated to be about 5cm; it is 4.3cm, so it is a bit over-estimated. After 2 seconds, the line width expands to about 7 cm.
Edge drive
The edge drive is controlled by the mixer module. The call to follow an edge is
mixer.setEdgeMode(true, 0);
The first parameter, 'true', is to follow the left edge; if false, then the left edge. The second parameter, '0', is an optional offset; it gives the possibility to follow the offset with an offset. The offset is in meters and up to about 0.04 (4cm) offset should be possible. It can enhance driveing in curves with high speed. The offset is a signed value and positive will try to keep the edge left of the robot centre line.
If an edge is not detected, no turning will be commanded (i.e., continue straight). Behaviour control should catch this situation and do something sensible.
Edge controller
The edge position is compared to the desired offset in a PID controller.
The PID controller parameters are in the robot.ini configuration file, in the [edge] section:
[edge]
...
kp = 40.0           (proportional gain)
lead = 0.3 0.5      (tau_d (sec) and alpha)
taui = 0            (integrator time constant (sec))
logcedge = true     (edge follow details log)
logctrl = true      (pid details log)
printctrl = false
maxturnrate = 12.0  (limit to output control turnrate)
The 'kp' is the proportional gain of the error, and the error is the difference between the desired offset and edge position.
After the 'Kp', the result is filtered in a 'Lead' filter with a zero and a pole (in the Laplace domain); the time constant of the zero (tau_d) is here 0.3 seconds. The time constant of the pole is the same as the pole multiplied by alpha, here 0.5.
The integrator time constant 'taui' is in seconds (integrator gain is then 1/taui).
After the PIT, the output is limited to 'maxturnrate' and is then available for the heading control. If the output is limited or the motor controller is limited, then the PID integrator stops integrating to avoid windup.
This module can generate two logfiles; the overall control values (if flag logcedge is true data goes into log_edge_ctrl.txt):
% Edge logfile: log_20231228_103218.821/log_edge_ctrl.txt
% 1 	Time (sec)
% 2 	heading mode (edge control == 2)
% 3 	Edge 1=left, 0=right
% 4 	Edge offset (signed in m; should be less than about 0.01)
% 5 	Measured edge value (m; positive is left)
% 6 	control value (rad/sec; positive is CCV)
% 7 	limited
1703755939.2403 2 1 0.0000 0.0556 4.3884 0
1703755939.2482 2 1 0.0000 0.0576 4.4334 0
1703755939.2553 2 1 0.0000 0.0586 4.4058 0
1703755939.2633 2 1 0.0000 0.0604 4.4353 0
1703755939.2723 2 1 0.0000 0.0592 4.2392 0
1703755939.2803 2 1 0.0000 0.0593 4.1474 0
The PID details can also be logged using flag logctrl, if true PID details goes into log_edge_pid.txt):
% Edge control logfile: log_20231228_103218.821/log_edge_pid.txt
% PID parameters
% 	Kp = 40
% 	tau_d = 0.3, alpha = 0.5 (use lead=1)
% 	tau_i = 0 (used=0)
% 	sample time = 8.0 ms
% 	(derived values: le0=1.97403, le1=-1.92208, lu1=-0.948052, ie=0)
% 1 	Time (sec)
% 2 	Reference for desired value
% 3 	Measured value
% 4 	Value after Kp
% 5 	Value after Lead
% 6 	Integrator value
% 7 	After controller (u)
% 8 	Is output limited (1=limited)
1703755939.2403 0.000 0.056 -2.223 -4.388 0.000 -4.388 0
1703755939.2482 0.000 0.058 -2.303 -4.433 0.000 -4.433 0
1703755939.2553 0.000 0.059 -2.345 -4.406 0.000 -4.406 0
1703755939.2633 0.000 0.060 -2.414 -4.435 0.000 -4.435 0
1703755939.2723 0.000 0.059 -2.368 -4.239 0.000 -4.239 0
